
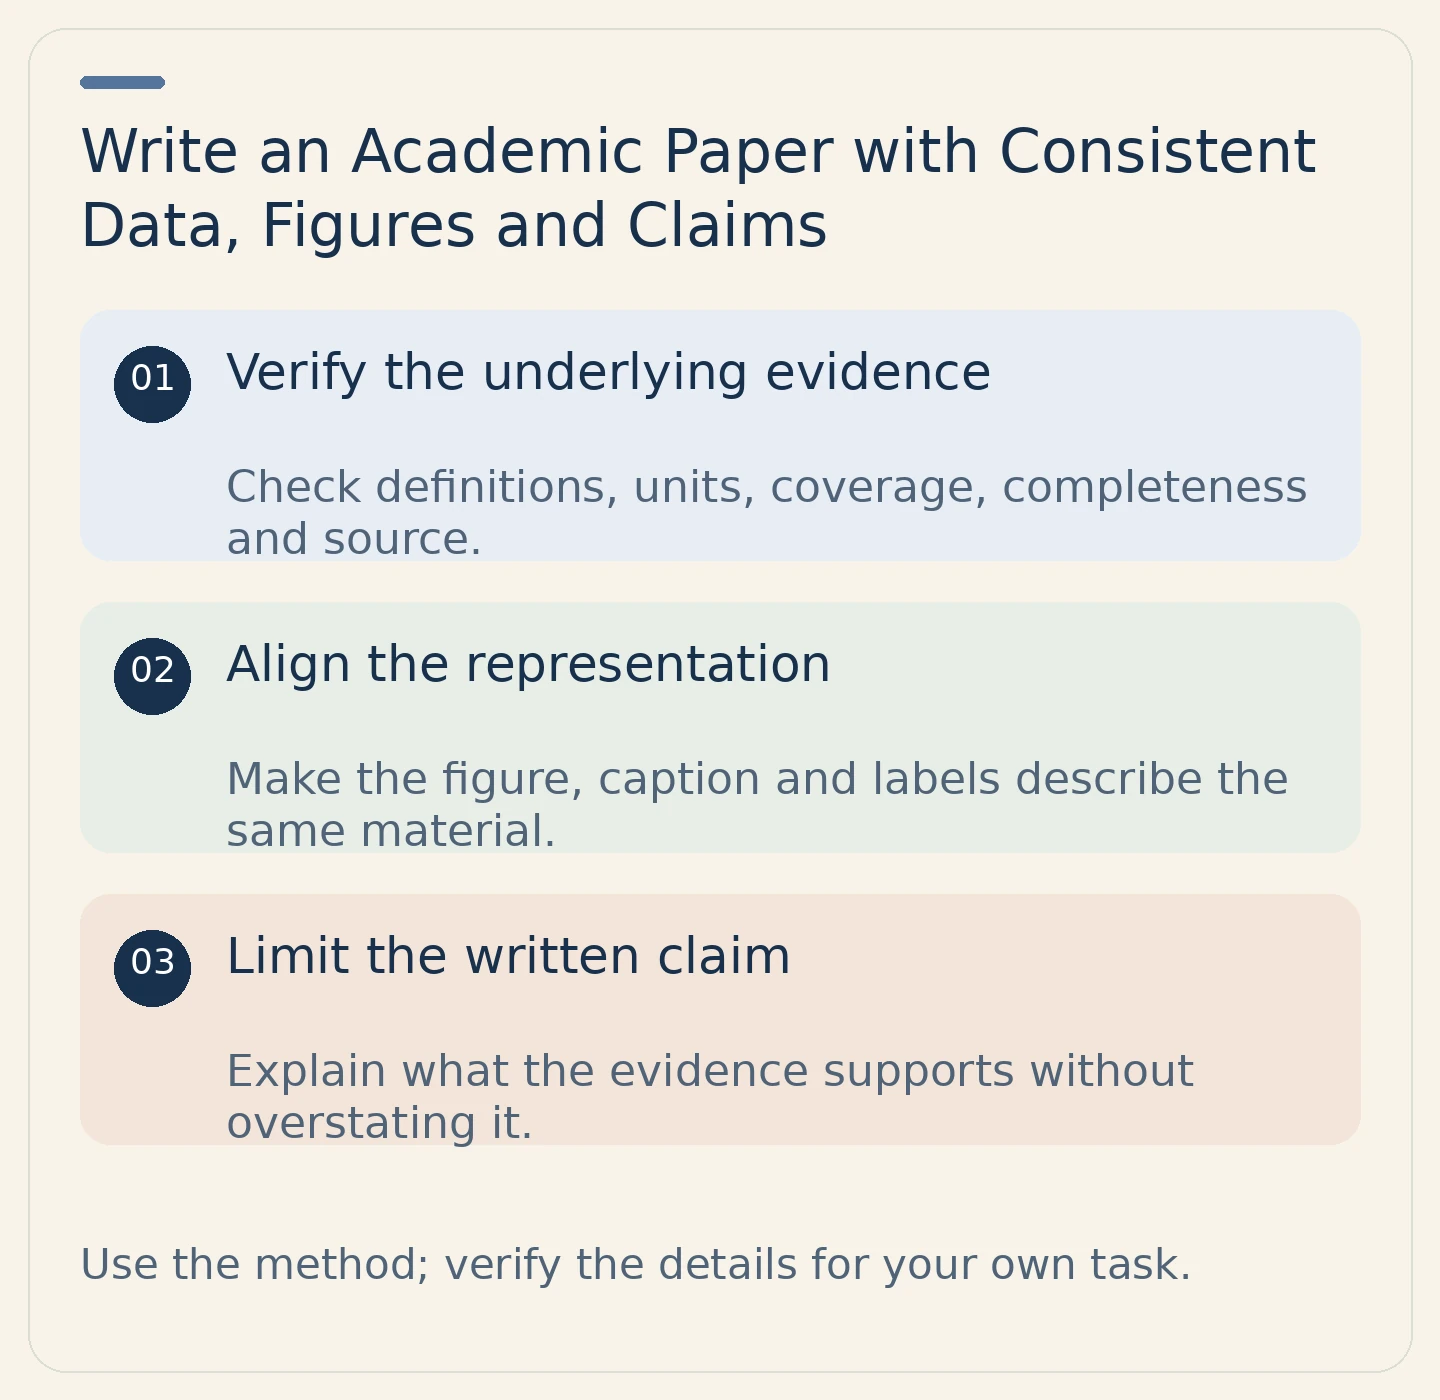
A chart can be accurately drawn while the surrounding prose overstates what it shows. A table can have a source but omit the definition readers need to interpret it. To use numerical and visual evidence responsibly, check the underlying material, the displayed representation and your written conclusion together. This review belongs within the full academic writing process, not as an isolated formatting task.
Plan the paper and the role of each visual
Read the assignment, rubric, required evidence, citation style, length and submission rules. Check permissions for assistance and any restrictions on data sharing. Write a working answer and outline the reasons supporting it. Decide whether a figure or table actually helps answer the question, rather than adding one to make the paper look more technical.
Read suitable sources and record their identity, version and actual evidence locations. Separate exact wording, your summaries and your own interpretation. For data, also retain the definitions, units, coverage period and population or material represented. A number without that context is not yet usable evidence.
Check what the data actually describe
Before creating a display, write a plain-language account of the evidence. What was counted or measured? For whom, where and when? Are the entries complete, comparable and expressed in the same units? If the material has limitations or missing information, keep them visible rather than silently treating absence as a zero or filling a gap.
Do not introduce statistical significance, causal effects or generalizability claims unless the actual evidence and appropriate method support them. A clear display cannot strengthen the underlying design beyond what it establishes.
| Review item | Source check | Display and prose check |
|---|---|---|
| Definition | What does the measure mean? | Use the same meaning in headings and discussion |
| Unit | What quantity is being reported? | Label consistently and do not switch scales silently |
| Coverage | Which period, setting and population apply? | Keep the stated conclusion within that scope |
| Completeness | What is absent or uncertain? | Explain relevant gaps rather than hiding them |
| Source | Where did the data or image originate? | Provide clear attribution in the required form |
| Claim | What can this evidence establish? | Avoid a stronger conclusion in the text or caption |
Align the figure, caption and paragraph
Give the visual a purpose. A caption should help identify what readers are seeing and any relevant source or limitation; the paragraph should explain why it matters to the argument. Do not repeat every entry in prose, but do not leave readers to infer the argument from the image alone.
Illustrative example using invented values: a table records attendance at two workshops as 12 and 15. That display concerns attendance, not learning quality. A paragraph claiming that the second workshop taught more effectively goes beyond the information. The example is a check on interpretation, not a real dataset or a lesson in statistical inference.
If the comparison is not valid because definitions or settings differ, explain the limit or choose a different presentation. Do not make unlike measures appear comparable merely by putting them beside each other.
Distinguish attribution from permission
Drawing a chart yourself does not make the underlying borrowed data your discovery. Identify the data source. If you reproduce or adapt an existing visual, check both the required acknowledgment and any applicable license, permission or institutional requirements. Citation and authorization are different questions; a citation alone does not settle every use.
Verify the actual source rather than crediting a search result or an AI-generated description. Keep original evidence and your transformations distinguishable in your working materials. If you cannot establish the source or meaning, pause its use rather than inventing missing details.
Draft and review the whole argument
Build paragraphs around your claims and reasoning. Paraphrase source ideas independently, preserve qualifications and cite them. Quote exact language when needed with the assigned formatting and real locators. University of Toronto guidance on acknowledgment explains why using your own wording does not remove the source’s contribution.
Check citation-reference correspondence under the required style, including captions, tables and appendices. If permitted, inspect Turnitin matches in context. Its student guide explains that similarity is not a plagiarism judgment. A low score cannot verify a chart, detect an overclaim or grant permission to reuse an image.
Inspect the actual submission file
Review the argument for task fit and the language for precision. Confirm that figure references point to the right visual and that captions, symbols, legends and source notes remain legible after export. Check required disclosures and attachments. Upload the intended file through the authorized route and retain confirmation and genuine records.
The useful final test is three-way agreement: the source, the display and the written interpretation should describe the same evidence with the same limits.
Related practical guides
For a separate evidence check, use the citation readiness guide; for the final handoff, use the pre-submission checklist. These are supplementary resources, not your institution’s submission system or policy.
Sources and scope
Further reading: University of Toronto: How Not to Plagiarize; University of Toronto: Using Quotations; Turnitin: Understanding the similarity score for students. Institutional examples apply to their own settings; follow the requirements governing your work.